The latest signs indicate that the U.S. economy is cooling. This year, the Fed has remained focused on inflation control and kept rate cuts on hold. There is “bad news is good news” behavior in the market, where stocks rally and bond yields fall upon weak economic data that could prompt rate cuts.
- Inflation slightly declined, with the consumer price index (CPI) remaining at 3.3%, slightly below the 3.4% forecast.
- The Personal Consumption Expenditure (PCE) price index slowed to 2.6%. Prices for physical goods fell, while prices for services increased.
- The Fed Funds Rate was unchanged, and the Fed scaled back to one cut this year.
- Markets are pricing in one to two 25 basis points (bps) cuts at the beginning of Q3, as inflation is expected to gradually decline.
- Unemployment and manufacturing point to slowing economic growth.
- Continuing claims increased 18,000 to 1.84 million – a two and a half year high – while initial claims fell.
- The Manufacturing Purchasing Managers’ Index (PMI) registered 48.5%, with new orders, backlogs, and production all contracting.
- The yield curve steepened further but remains inverted.
- Treasury yields rose after the PCE report, but fell after unemployment weakened.
- Yields are breaking out of a 42-year long-term trend (Figure 1). Despite potential rate cuts, interest rates are expected to be in a higher range than the low interest rate regime post the Global Financial Crisis of 2008 – with 10-year Treasury yields expected to remain in the 4 to 5% range.
- Artificial intelligence (AI) and infrastructure spending are expected to drive long-term growth, though broader AI adoption has yet to “cross the chasm,” due to challenges including cost, safety, and data infrastructure.
- Diversification is crucial as the breadth of the equity rally narrowed, while concentration increased further.
Figure 1. Interest Rates Have Broken Out of a 42-Year Trend

Risky Assets Rallied to All-Time High after Correction; Bonds Recovered
Figure 2. Asset Class Performance Year-to-Date

The S&P 500 gained 4.25% in Q2 after the pullback in April, and stocks are up 23.78% over the past 12 months.
- Mega-cap tech stocks continued to drive gains, led by AI company Nvidia, and valuation became more elevated.
- Tech leaders drove strong earnings; however, it will be more challenging to see returns.
- Value and dividend stocks once again lagged their growth counterparts (Figure 3). Alphabet GOOGL/GOOG was the latest tech giant to announce its first-ever dividend payment.
- Mid-cap and small-cap stocks declined 2.61% and 4.16%, respectively. Due to sensitivity to high interest rates, they contain a greater percentage of unprofitable companies (44% and 19%) than large cap (7%).
Figure 3. U.S. Equity Earnings and Valuation by Size and Style

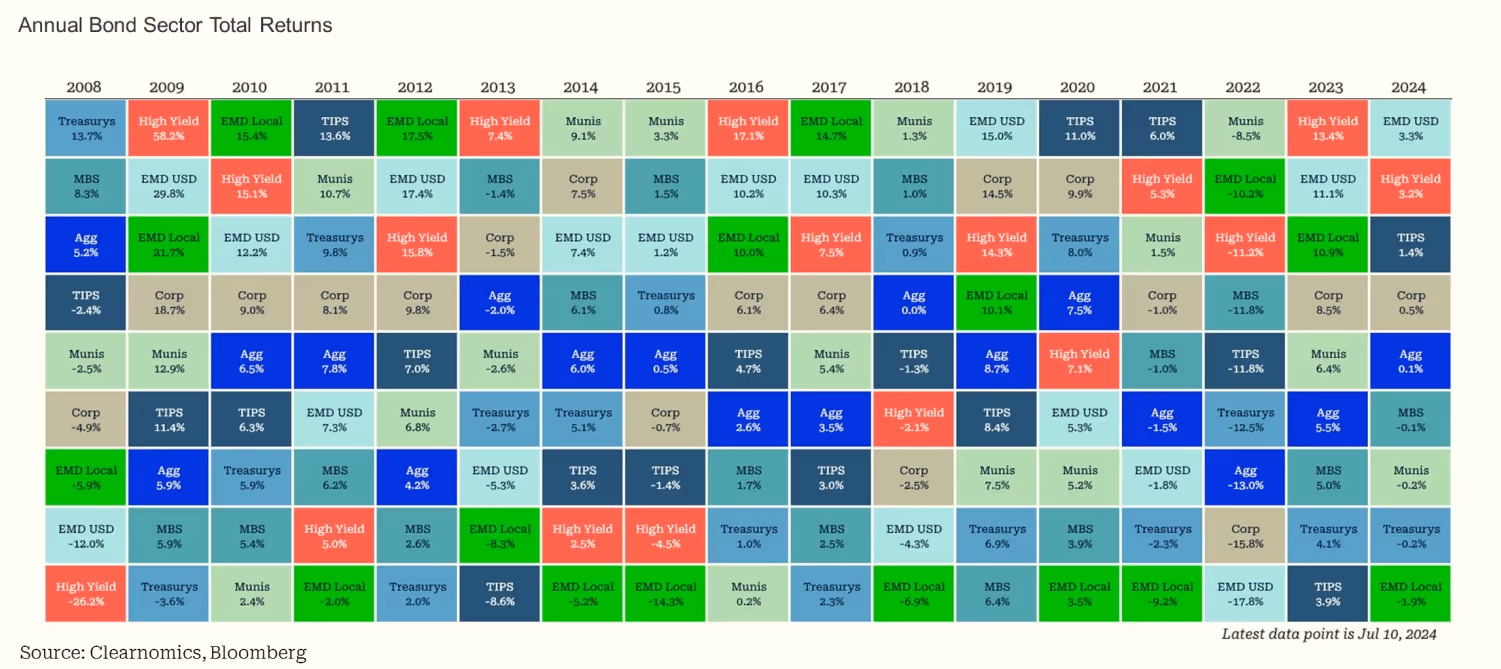
Bonds ended the Q2 narrowly in the positive (Figure 4)
- Core bonds gained 0.17% for Q2, in line with the 0.18% return on U.S. Treasury bonds.
- High-yield bonds saw larger gains of 1.07%, while longer-term yields lagged.
- With rate cuts on the horizon, the bond rally is expected to continue.
Figure 4. High Yield Has Led Fixed Income Performance
Oil prices fell, which helped bring down inflation, and Bitcoin lost momentum after a record-breaking Q1. Meanwhile, gold and copper prices rose, with gold increasing over 4% and copper soaring 8.51% in Q2.
Heightened Political Uncertainty: Debt and the Election
Record-high national debt and elevated interest rates pose risks to the economy.
- The budget deficit ballooned, due to the pandemic relief measures (Figure 5) – which, in the short-term, supported economic recovery, but resulted in higher debt and inflation down the line.
- National debt accelerated at an even higher rate than the post 2008 financial crisis period.
- Gross federal debt has increased by 70% since 2016 to $34 trillion, representing over 120% of the gross domestic product (GDP).
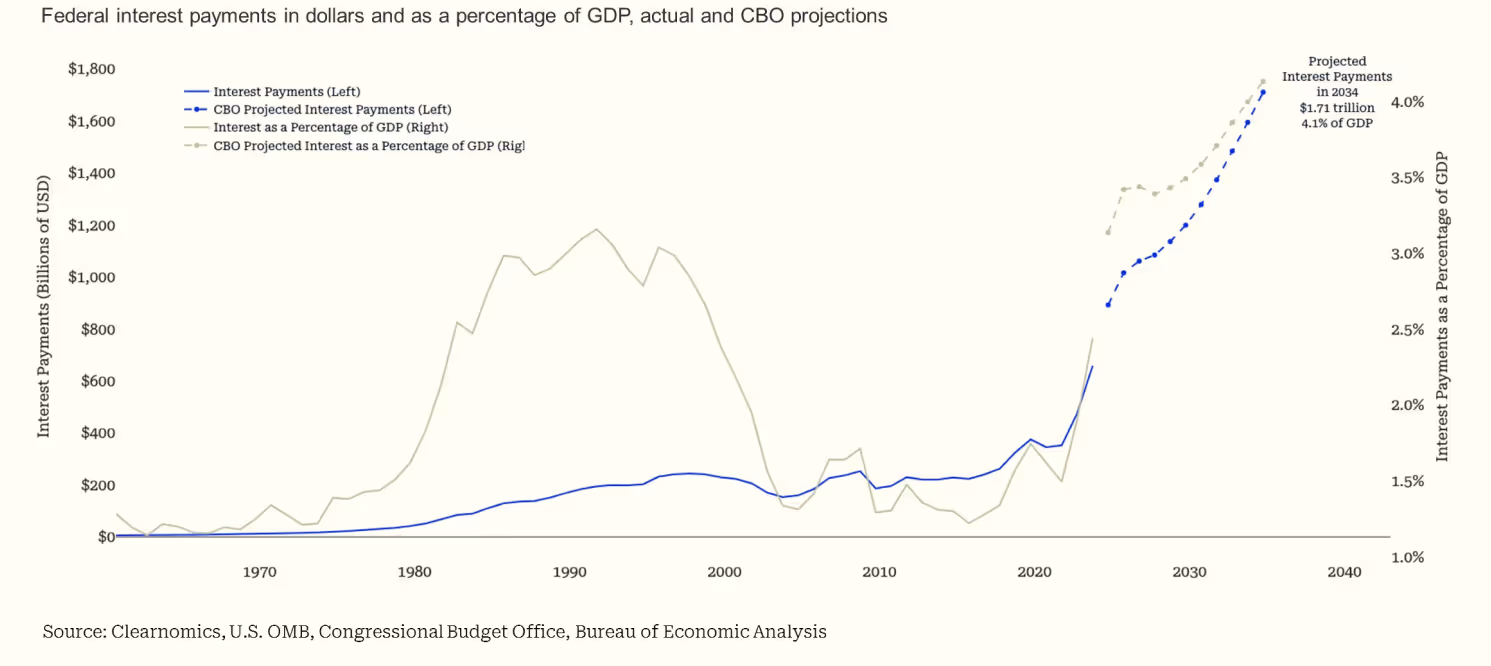
- As the Fed raised interest rates to combat inflation, gross interest payments jumped to $1 trillion in 2023.
- Net interest payments will surpass Medicare and defense spending in 2024 (Figure 6).
- This results in a vicious cycle, where treasury yields rise, due to concerns surrounding the sustainability of U.S. public finances.
- Treasury auction demand weakened, as rating agencies and investors have became wary of more supply and demand higher yields.
Figure 5. Federal Budget Deficit

Figure 6. Federal Interest Payments on National Debt
Headline risk from U.S. Elections
- Few are expecting either political party to significantly rein in spending or address the U.S. debt.
- The spillover effects from a lack of addressing spending can crowd out private sector demand, keeping rates “higher-for-longer.”
- We should expect that neither political party will rein in spending, as the U.S. government has not run a balanced budget since the Clinton and Nixon administrations and neither opponent in the upcoming 2024 election has made spending a priority (Figure 5).
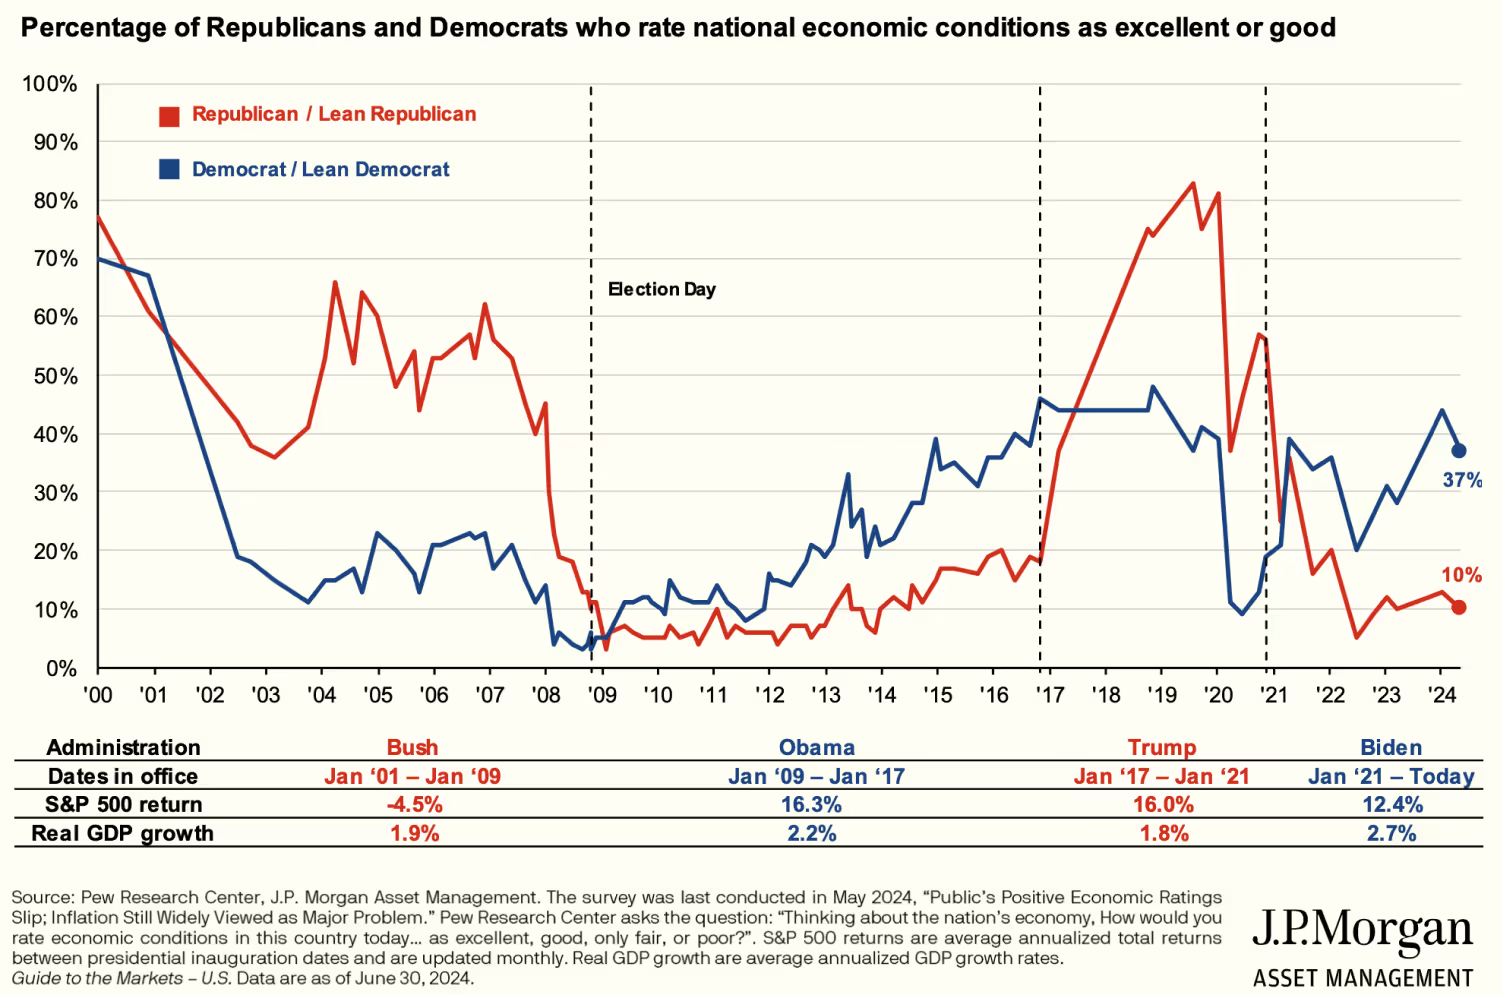
- The potential extension of tax cuts and other fiscal policies could influence economic stability. It is important to continue to monitor political developments over the coming months to make judgments on how policy and regulatory developments might impact the economy. Figure 7 shows that consumer confidence is split by political affiliation.
Figure 7. Consumer Confidence by Political Affiliation
Global Economies
Yield curves remain inverted in the UK and EU, indicating late-cycle and restrictive monetary policies.
- The European Central Bank (ECB) is leading rate cuts amongst major central banks.
- The first 25 bps reduction was in June, as inflation fell to 2.5%.
- Persistent wage growth will make ECB cautious over easing bps, as the euro-zone economy could be susceptible to an abrupt labor market slowdown in the near future.
- The number of cuts expected by year-end has been steadily dropping, now expected to be one to three cuts throughout the remainder of 2024.
- With tentative signs that the UK economy is recovering, the Bank of England (BoE) may not rush to cut rates and is likely to wait until Q3 before doing so.
- Japan remains the exception, as nominal GDP growth has remained well above average.
- Monetary policy is likely to remain accommodative for the foreseeable future in Japan.
Emerging market (EM) central banks are slow to cut rates, due to currency weakness concerns.
- Growth in China, for example, has yet to fully rebound, as the country’s economic recovery continues to be unbalanced.
Figure 8. Global Central Bank Policy Rates

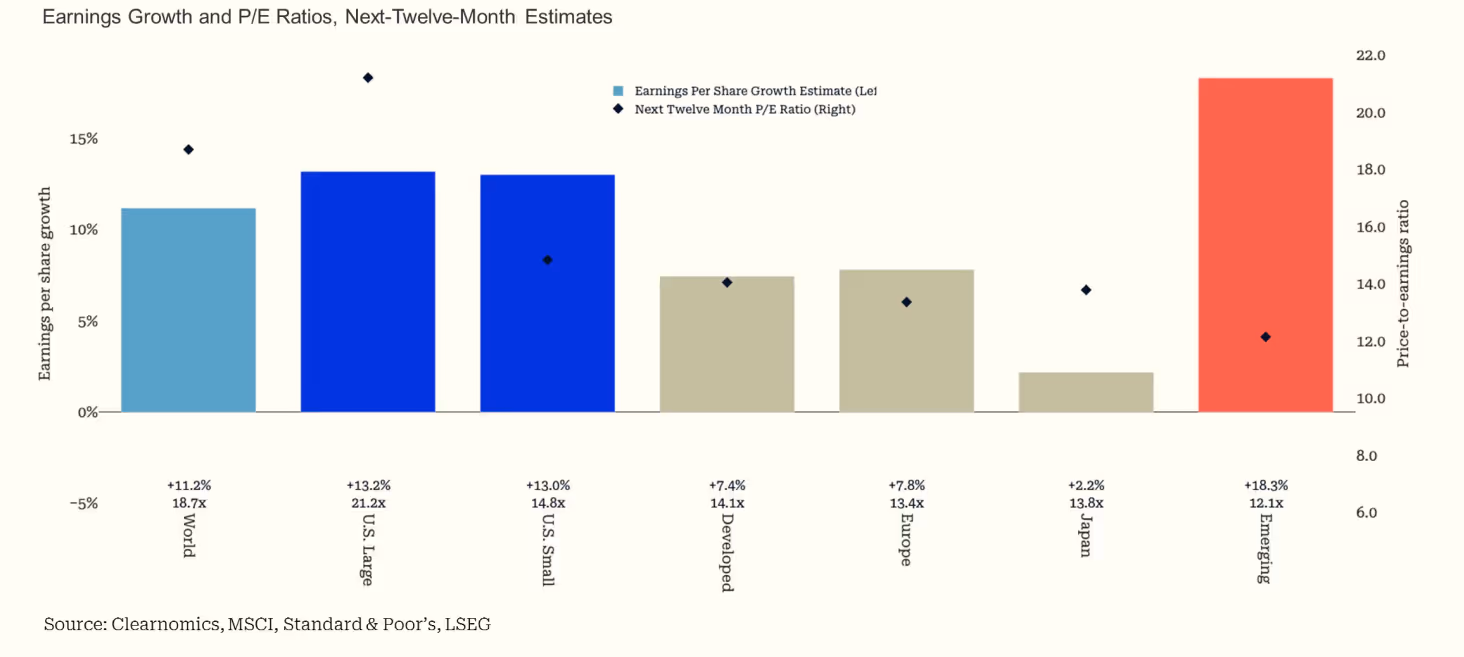
Figure 9. Global Asset Class Earnings and Valuations
Dynamic Asset Allocation - Adjustment Overview
Given the fundamental trends and relative valuation highlighted throughout this market commentary, we are diversifying the asset allocations in our Dynamic Multi-Asset Portfolios with a broader range of investment opportunities to build resilient and long-term growth-oriented portfolios:
- In U.S. equities portfolios, we continue to reduce the concentrated index exposure with:
- Profitable and high-quality companies at attractive valuation across all market capitalizations.
- Mid-phase and late-phase sectors that tend to see less deceleration in earnings as economic growth slows, including industries such as communication services, health care, consumer staples, and utilities.
- In global equities, we remain underweight international equities, including Europe and emerging markets:
- Replacing part of the EAFE exposure with the currency hedged version.
- Adding further exposure to Japan, where we see the greatest potential for economic resilience abroad.
- In fixed income portfolios, we continue to:
- Maintain an overweight to short-term treasury, intermediate investment grade (IG) credit, and high yield.
- Gradually add to mid- to long-duration funds, as fiscal risk balances potentially lower interest rates.
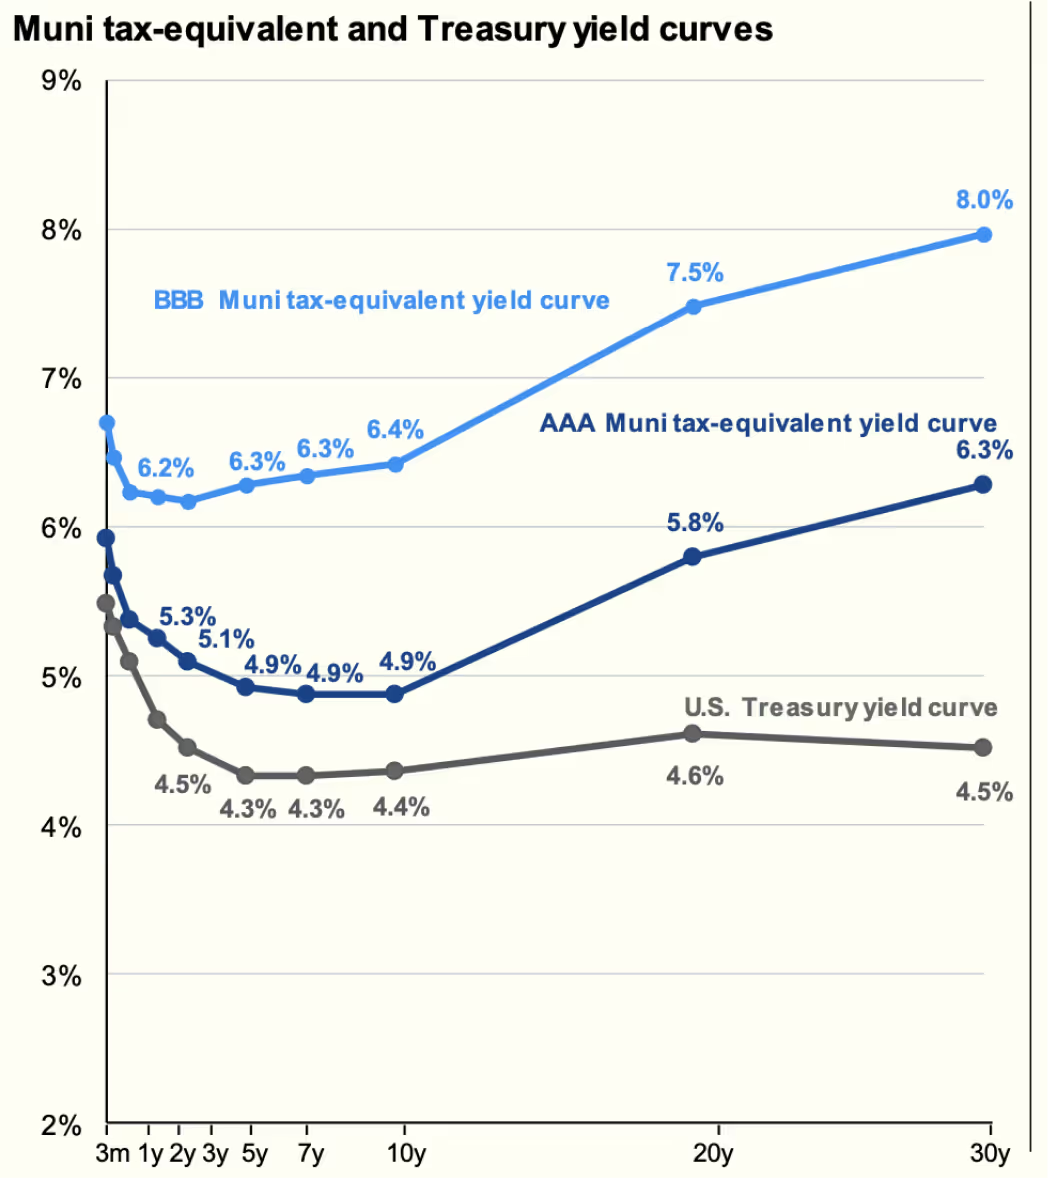
- Replacing index exposure with short- and long-end of municipals, given their different “barbell” yield curve (Figure 10).
- Remain overweight in bank loans, ABS and MBS given lower default risks than high yield within each rating.
- Adding gold, hedged equity and select alternatives to protect returns in a slow down (Figure 10).
Figure 10. Muni tax-equivalent and Treasury yield curves
These dynamic adjustments reflect our comprehensive top-down perspective and are designed to help client portfolios weather changing economic and market regimes. More detailed portfolio allocations, trade rationale, and performance attribution will be available to Farther clients on a regular basis.
We invite you to connect with your Farther wealth advisor for questions related to our Dynamic Multi-Asset Portfolios or this mid-year Market Commentary.